How AI Presentation Tools Track Engagement and Learning in 2026
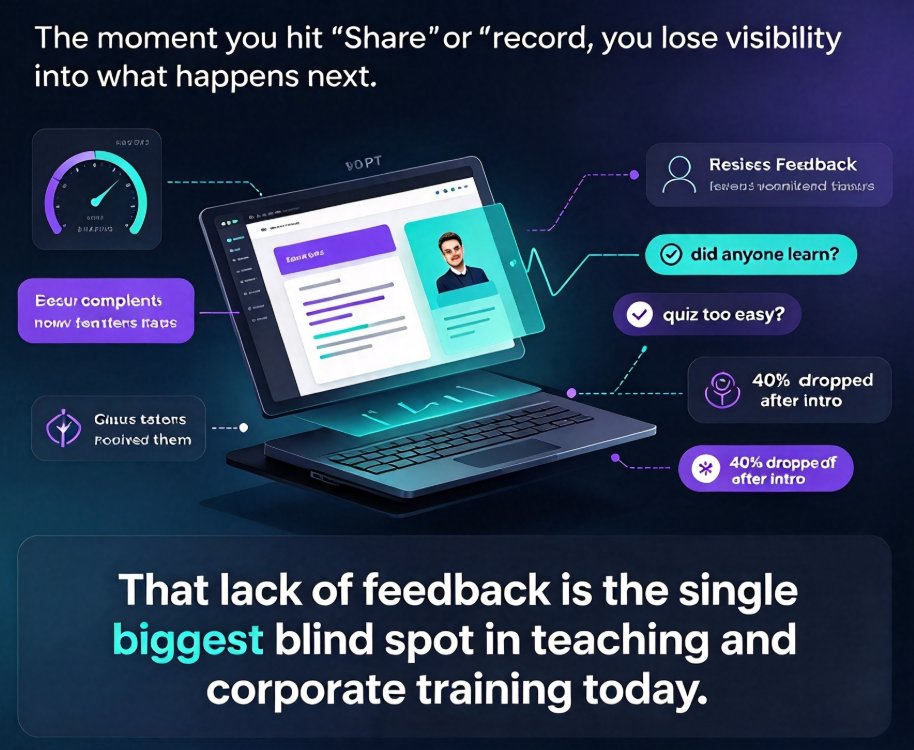
Let's be honest: how many hours have you poured into a presentation, only to walk away with zero idea whether anyone actually learned something? You craft the perfect narrative arc, source the right visuals, rehearse the timing — and then you present into a void. No signal comes back. No one tells you that slide 14 confused them, or that the quiz at the end of module three was too easy, or that 40 percent of viewers dropped off right after the introduction.
That lack of feedback is the single biggest blind spot in teaching and corporate training today. And it's the exact problem that analytics in AI presentation tools are finally starting to solve.
This isn't a distant future. The shift is already underway, and by the end of 2026 it will be the default expectation — not a nice-to-have. Here's what that new analytics layer looks like, what it means for you as an educator, and how to start using it before your competitors do.
01 — Why Your Deck Is Still a Black Box
Here's the uncomfortable truth about most presentations and eLearning content: the moment you hit "share" or "record," you lose visibility into what happens next. You might get a completion rate from your LMS, but that tells you nothing about whether learners actually understood or retained the material.
Think about the traditional feedback loop. You deliver a lesson, wait weeks for an exam or a survey, and then try to reconstruct what went wrong from a handful of muddy data points. By the time you act on the feedback, the next cohort has already moved on. The whole cycle is slow, indirect, and full of guesswork.
Now compare that to how product teams operate. They ship a feature, watch user behavior in real time, and iterate within days. They never rely on intuition when they have clickstream data. The best educators and trainers in 2026 are starting to adopt the same mindset — but they need the right tools to do it.
AI presentation platforms are evolving in exactly this direction. As we covered in our breakdown of 2026 presentation tool trends: agentic AI, personalization and more, the focus has shifted from simply generating prettier slides to building systems that understand how those slides perform.
02 — Viewer Attention Metrics: Seeing Where Learners Really Look
Let's get specific. What does "attention tracking" actually look like in an AI presentation tool?
At its core, it's behavioral data captured while learners interact with your content. Three signals matter most:
- Slide dwell time — how long a viewer stays on each slide before advancing. Extremely short dwell times suggest confusion or boredom. Extremely long ones might mean the content is dense — or that the viewer got stuck.
- Rewatch rate — whether viewers replay a specific section or slide. High rewatch rates on a particular module are a red flag that something wasn't clear the first time.
- Drop-off points — exactly where viewers stop watching. A sharp drop-off after slide five, for instance, tells you your introduction isn't hooking the audience.
These metrics sound simple, but they change everything. For the first time, an educator can see, with precision, the exact moment a lesson loses its audience.
The real promise of AI in teaching isn't faster design — it's closing the feedback loop between what you present and what people actually retain. Attention data is the first half of that loop.
For a practical starting point, one of the easiest ways to capture these signals is to convert your static slides into narrated micro-courses — a workflow we've explained in our guide to adding narration to slides with PPT-to-video — because video formats make behavioral tracking far more precise than flat PDFs or slide decks.
03 — Quiz Interactions: Turning Passive Viewers into Active Learners
Attention metrics tell you where people look. Quiz interactions tell you whether they actually learned anything — and that's a much higher-value signal.
This is where AI presentation platforms are converging with eLearning best practices. A 2026 guide from eLearning College identifies interactive content — gamified quizzes, simulations, and AI-driven assessments — as one of the five core features that keep learners engaged and measurably improve outcomes.
The logic is straightforward. When you embed a quiz directly into your slides or micro-course, every answer becomes a data point:
- A question that 85 percent of learners answer correctly confirms the preceding section worked.
- A question that 60 percent get wrong flags a comprehension gap you need to fix.
- A pattern of learners rushing through quizzes suggests the content isn't challenging enough.
This is radically different from the old model of teaching a unit, waiting three weeks, and then discovering through a final exam that half the class missed a key concept. With embedded assessments, you know within minutes of content delivery exactly where the gaps are.
If you want to see how this works in practice, our tutorial on adding interactive quizzes to micro-courses walks through the mechanics of turning passive slideware into an interactive learning experience.
04 — Content Effectiveness Scores: One Number That Tells You What Worked
Now we get to the real game-changer. Raw metrics are useful, but educators don't have time to parse ten different dashboards. That's why the next frontier of AI presentation analytics is the content effectiveness score — a composite metric that consolidates attention data, quiz performance, completion rates, and rewatch behavior into a single number.
Think of it like a Net Promoter Score for your courseware. Instead of asking "did they finish the video?", you ask "did this content actually work?" — and you get a number that tells you so.
Here's how it typically breaks down:
| What It Measures | Old-School Method | AI-Driven Analytics |
|---|---|---|
| Attention | Post-deck survey (weeks later) | Slide dwell time captured in real time |
| Comprehension | End-of-course exam | In-slide quiz interactions per viewer |
| Effectiveness | Instructor intuition | Composite effectiveness score across cohorts |
| Iteration cycle | Next semester | Next session |
The last row is the one that should grab your attention. Traditional feedback loops take months. AI analytics compress that cycle to days or even hours.
A content effectiveness score doesn't just tell you how one course performed — it lets you compare modules against each other, identify your strongest teaching patterns, and replicate what works. Over time, you build a library of content that's been validated by real learner behavior, not just your gut feeling.
05 — What This Means for Educators: Think Like a Product Team
The biggest mindset shift for educators in 2026 is abandoning the "one-and-done" approach to course creation. You're not writing a textbook anymore. You're running a product that ships, gets measured, and gets improved.
Take a concrete scenario. You create a ten-slide micro-course on data privacy, record narration, and distribute it to your employees. With AI analytics, you discover that:
- Viewers spend unusually long on slide six, which explains a complex compliance scenario.
- The quiz after that section has a 62 percent accuracy rate.
- 30 percent of viewers drop off before finishing the course.
Each signal points to a specific fix. Slide six needs simplification — maybe a diagram instead of a wall of text. The quiz question might be poorly worded, or the preceding section lacks a concrete example. The drop-off suggests the course is dragging; tightening the middle section could hold more viewers.
By 2026, the winners in education and corporate training won't be the teams with the fanciest slides — they'll be the ones who treat every deck as a live experiment. Data-driven iteration is the new competitive advantage.
This is exactly why platforms like Zendeck are building toward a future where analytics are baked into the content creation workflow — not bolted on afterward. If you can generate a deck, convert it to a narrated micro-course, distribute it, and then track how learners engage with specific sections, you've got a complete closed-loop system.
Courseware design is also shifting from static templates to what we call contextual, performance-aware layouts — a trend we've explored in depth in our article on contextual templates versus generic ones. Templates that adapt to the content and to learner behavior are the direction everything is heading.
06 — The Data-Driven Loop: Create, Deliver, Measure, Optimize
Let's visualize how all these pieces fit together. The modern AI-powered content workflow isn't a straight line from creation to delivery — it's a continuous feedback loop.
Each stage feeds the next. You create a deck or micro-course, deliver it to learners, measure how they engage and perform, and then optimize the weakest sections before the next cohort sees it. The loop repeats, and each pass makes your content measurably better.
This is why the analytics conversation matters so much right now. Tools that only generate slides — no matter how beautiful — are solving half the problem. The platforms that will define the next decade are the ones that integrate measurement directly into the workflow.
And that's not a distant vision. If you're already producing video-based courseware, the infrastructure for tracking engagement exists. Our category guide on PPT-to-video production covers how to turn existing slides into trackable micro-courses without starting from scratch.
07 — The Road Ahead: Teaching as a Continuous Experiment
If there's one takeaway from all of this, it's that the role of the educator is evolving. You're no longer just a content creator. You're becoming a learning experience designer who uses data to refine every touchpoint.
That's a shift that will feel uncomfortable at first. It's natural to worry that "data-driven teaching" means losing the human touch. But here's the thing: analytics don't replace your judgment — they sharpen it. The effectiveness score tells you a slide underperformed, but you decide whether to simplify the copy, swap in a better visual, or add a real-world example. The data points to the problem; your expertise solves it.
Platforms like Zendeck are building toward exactly this future. The vision is simple: you bring the subject matter expertise, the AI handles the design and delivery, and the analytics layer helps you refine your teaching materials based on how learners actually respond. Upload an outline or markdown file, let the system generate a polished deck, convert it to a narrated micro-course, and then use engagement insights to iterate — the entire lifecycle in one place.
The 2026 landscape is being shaped by questions like these: Which content actually changes behavior? Which lessons stick? Which presentations deserve to be retired? The educators and trainers who start collecting real engagement data now will have a massive head start over those waiting for the trend to mature.
Start small. Pick one course, embed a few interactive elements, and watch what the analytics tell you. The feedback loop is the single best teacher you haven't hired yet.
FAQ
Q: What exactly are viewer attention metrics in AI presentations?
Viewer attention metrics capture behavioral signals like how long someone stays on each slide, whether they rewatch a section, and where they drop off entirely. In AI-generated micro-courses and video decks, these signals tell you which parts of your content actually held attention and which ones lost people. It's the closest thing we have to reading an audience's mind in an asynchronous setting.
Q: How do quiz interactions help educators measure learning outcomes?
Embedded quizzes transform passive viewers into active learners, and every answer becomes a data point. If 70 percent of learners miss the same question, that section needs to be reworked. If everyone aces a quiz instantly, the content is probably too easy or too repetitive. Quiz interaction data reveals comprehension gaps in real time — no waiting for a final exam to discover what didn't land.
Q: What is a content effectiveness score?
A content effectiveness score is a composite metric that combines multiple engagement signals — attention duration, quiz accuracy, completion rate, and rewatch frequency — into a single number. Instead of juggling a dozen dashboards, educators get a quick read on whether a slide, module, or entire course achieved its goal. Drop the score below a threshold and you know exactly which sections need redesign.
Q: How can educators use AI presentation analytics to improve courseware?
The practical workflow is: generate a deck or micro-course, deliver it to learners, track how they interact with each section, and then iterate based on the data. Weak sections get rewritten or supplemented with new visuals or examples. Strong sections become templates for future content. It turns course creation from a one-shot effort into a continuous improvement cycle.
Q: Will AI analytics replace traditional student feedback?
No. AI analytics give you behavioral data — what learners did — but not the why behind it. A drop-off at a specific slide tells you something is wrong, but only direct feedback (surveys, interviews, or forum comments) explains whether it was confusing, boring, or poorly narrated. The best approach is to combine both streams: use analytics to find the problem spots and use human feedback to understand them.