Data Visualization on Slides: Master Zendeck's Asset Library
Let's be honest: you've sat through a data-heavy presentation where every slide looked like a spreadsheet had a baby with a PDF. The data was there, but the story was buried. The problem isn't the numbers—it's how you present them. Most people underuse their presentation tool's asset library, leaving icons, charts, and illustrations sitting unused while their slides stay dense and lifeless. In this guide, I'll walk you through how to use Zendeck's asset library to turn raw data into visuals that actually communicate.
01 Why Data Slides Fail (and the Fix)
Most data slides fail for one simple reason: they treat the slide like a document. You're copying bullet points, pasting tables, and hoping the audience reads them. That's a losing game. The human brain processes visuals 60,000 times faster than text, but that stat only matters if you give the brain something visual to work with.
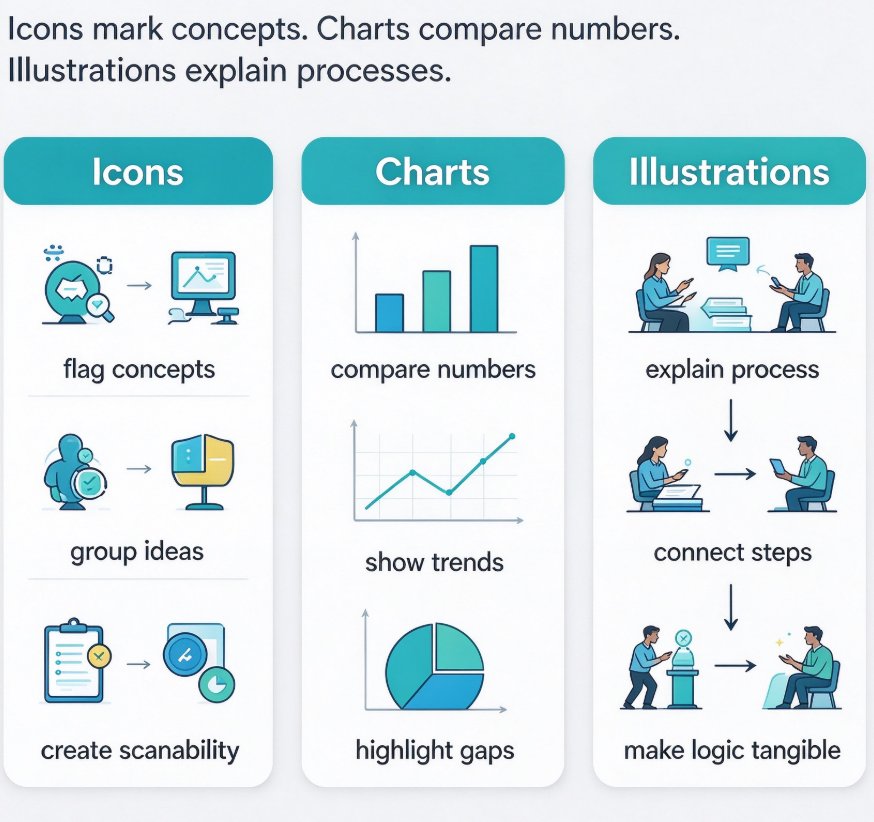
Here's the fix: stop building slides with text alone. Pull in icons to mark concepts, charts to compare numbers, and illustrations to explain processes. The moment you add a visual, you give your audience a mental hook.
The fastest way to make a data deck feel professional is to let the asset library do the sourcing for you.
02 The Three Building Blocks: Icons, Charts, Illustrations
You have three main weapons in your asset library, and each one has a job.
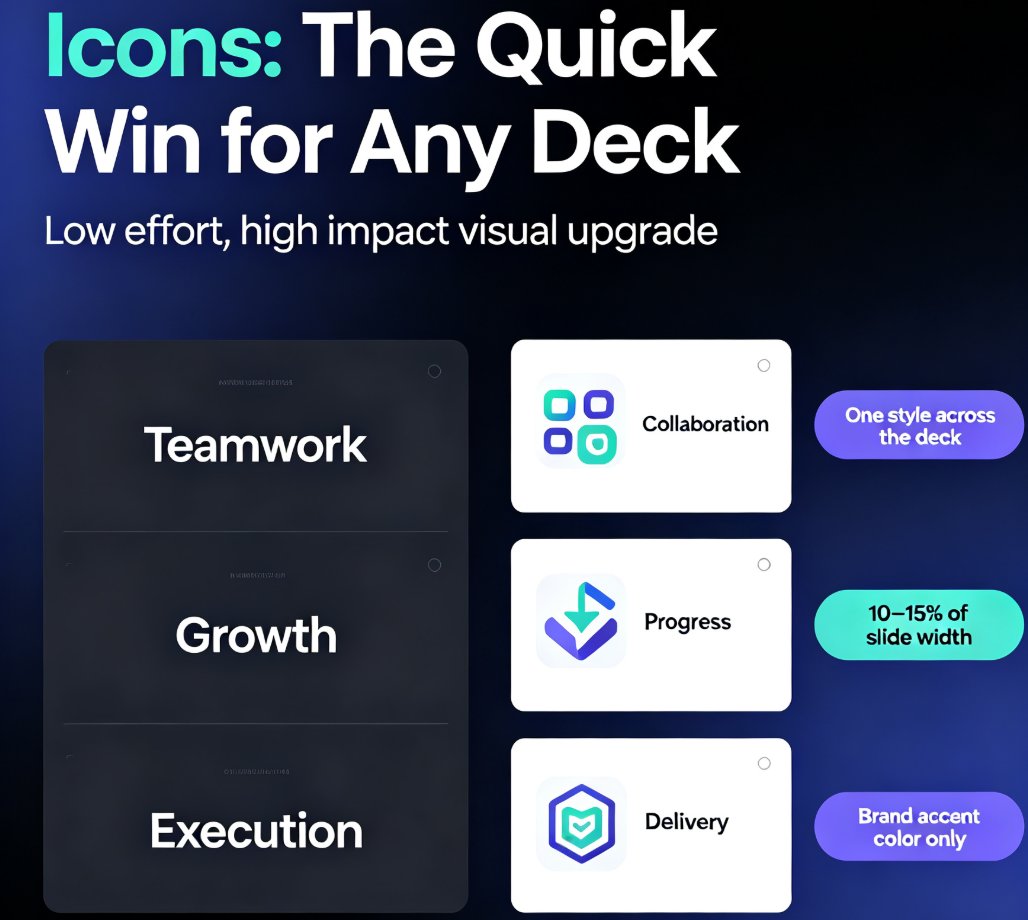
- Icons: for quick concept reinforcement. They're small, simple, and perfect for labeling a category or drawing attention to a key point. If you're talking about e-commerce growth, a small cart icon next to the number says it instantly.
- Charts: for quantifiable comparisons. When you have numbers that need to be compared—revenue, traffic, conversion rates—charts are your main tool. A bar chart for comparisons, a line chart for trends, a pie chart for proportions.
- Illustrations: for complex processes and emotional messages. A flowchart of a customer journey, or an illustration of a scenario, can convey what a paragraph would take.
Here's the critical rule: a visual without a clear job is just decoration—give it a purpose.
| Visual Type | Best For | Example Scenario |
|---|---|---|
| Icons | Quick concept reinforcement | A cart icon next to "E-commerce sales up 24%" |
| Charts | Quantifiable trends and comparisons | A bar chart showing quarterly revenue growth |
| Illustrations | Explaining processes or emotional messages | A customer journey flowchart with touchpoints |
Let's be real: choosing the right visual is where most people get stuck. That's where Zendeck's asset library shines—it's integrated into the deck builder, so you don't need to leave the tool to find the right visual.
03 How Zendeck's Asset Library Fits In
Here's a scenario that plays out every week: you have a Word document full of stats about your team's performance. You're about to copy-paste that data into a slide, and you're dreading it.
With Zendeck, you just upload the Word outline (or paste markdown), and the smart layout preserves your structure. The next step is where the magic happens: Zendeck's asset library suggests relevant icons, charts, and illustrations based on your content. If you have a block of numbers, it can suggest a bar chart or a pie chart. You don't need to hunt for a diagram elsewhere—it's all in one place.
According to industry benchmarks, leading platforms now offer over 35,000 brand-approved designs per library. Zendeck's asset library follows this trend, covering icons, charts, and illustrations that match your content.
Let's say you're presenting website traffic by geography. Instead of a table of city names, Zendeck can pull in a heat map or a column chart. This is exactly what data visualization experts recommend—matching the visual to the data type.
04 Practical Tips for Pairing Visuals with Data
Now let's talk about the actual craft. You can't just drop any chart into a slide and call it done. Use these four tips to make your data visuals work harder:
- Match the chart to the relationship. Line for trends, bar for comparisons, pie for parts of a whole. If you're showing a percentage breakdown, a pie works; for a trend, use a line.
- Label like you mean it. Every chart needs a title, axis labels, and data callouts. If the audience can't read it in five seconds, it's a failure.
- Keep icons subtle. Icons should reinforce, not overpower. Use a consistent style and size, and place them near the text they support.
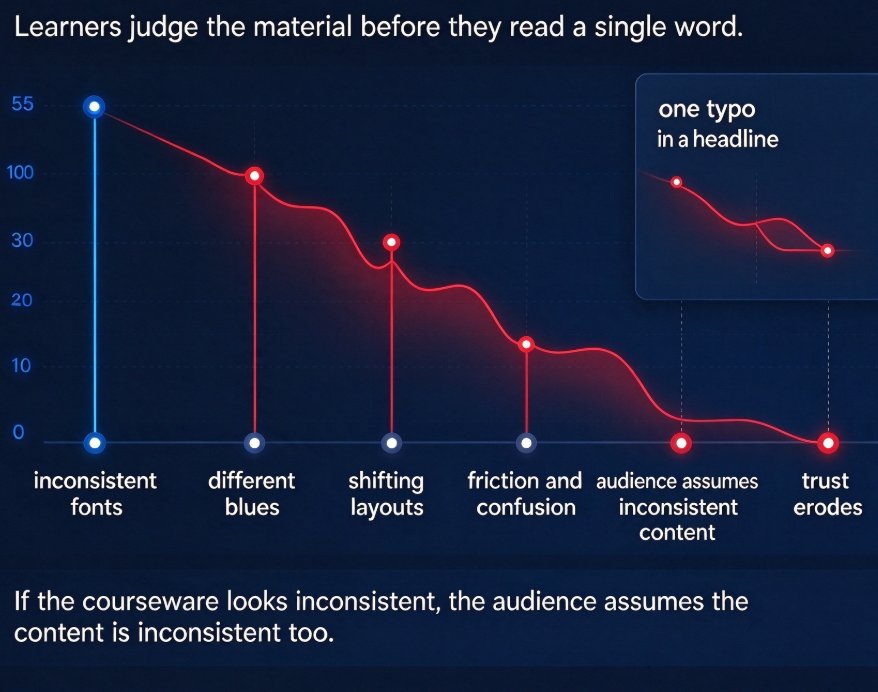
- Don't forget brand consistency. This is where a brand kit comes in. Zendeck's brand kit ensures every slide uses your approved palette, fonts, and logo placement. No more drifting colors or mismatched chart styles.
05 Avoid These Pitfalls
You've seen the deck where every slide is a different color scheme, or where the chart is too small to read. Here are the common pitfalls and their fixes:
- Inconsistent branding. It's easy to let colors drift slide to slide. Fix: Use Zendeck's brand kit to lock in your palette and fonts.
- No visual hierarchy. Your outline might be 80% text. Fix: Let Zendeck suggest visuals from the asset library to pull attention where it matters.
- Overcrowding. Too many visuals is just as bad as too many words. Fix: Use one strong visual per slide, not three.
- Generic icons. Don't pick a random icon because it's the first look. Fix: Search the library for icons that match your exact concept.
06 From Deck to Micro-Course
Here's a bonus: once your data-heavy deck is done, you can turn it into a narrated micro-course. Zendeck's PPT-to-video feature converts static slides into a video with AI-generated voiceover and subtitles. This is gold for training and e-learning—your data visuals become part of a story that people can watch anytime. For more on this, check out how to add narration to your slides with Zendeck's PPT-to-video.
Imagine a training module on sales performance: slides with clean charts, an AI voiceover explaining the numbers, and subtitles for accessibility. That's not a future trend; it's a workflow you can set up in minutes.
FAQ
What types of visuals are in Zendeck's asset library?
Zendeck's library includes icons, charts (bar, pie, line, heat map), and illustrations. These are searchable and integrated into the slide builder, so you can add them without leaving the editor.
How do I choose between an icon, a chart, or an illustration?
Use icons for quick concept reinforcement, charts for quantifiable comparisons, and illustrations for complex processes or emotional messages. If you're showing revenue growth, a bar chart is better than an icon; if you're explaining a customer journey, a flowchart helps.
Can Zendeck suggest charts automatically when I import a document?
Yes. When you upload a Word outline or paste markdown, Zendeck's smart layout analyzes the content. If it detects a data block, it can suggest an appropriate chart type, like a bar or pie chart, from the asset library.
How do I keep branding consistent when adding visuals?
Use Zendeck's brand kit to set your approved palette, fonts, and logo. The asset library visuals will follow this kit, so every chart and icon you add matches your brand automatically.