How a Consultant Created a Data-Rich Case Study Deck in 10 Minutes with Zendeck
Imagine this: You land a new client engagement. They’ve sent you a Word document with 20 pages of raw data, interview notes, and a vague outline. Your deliverable is a case study presentation that tells a compelling story — but you have only six hours before the pitch meeting.
Most consultants would spend the first two hours just formatting slides, copying data into tables, and searching for icons. Not this time.
Let me walk you through how a real management consultant — let’s call her Sarah — turned a messy outline into a data-rich, client-ready case study deck in 10 minutes using Zendeck. No design background. No late-night formatting. Just a clean, repeatable workflow.
01 / The Problem: Unstructured Data, Unforgiving Deadlines
Sarah had worked with five different client teams over the past month. The final deliverable for the quarter was a case study synthesizing three months of operational data, customer interviews, and financial metrics. The raw materials:
- A 40-page Word document with bullet points, tables, and scattered notes.
- A spreadsheet with 12 tabs of KPIs, trend lines, and benchmarks.
- A folder of brand logos and screenshots — no consistency.
The pain point: Every minute spent on formatting was a minute stolen from analysis. Her team had already tried building slides manually in PowerPoint, but after three hours they had only 4 slides, and they looked like a college project.
The solution: Sarah decided to feed everything into Zendeck’s AI deck generator. She opened the platform, pasted the outline (Markdown format), and let the AI handle the structure. Within 90 seconds, Zendeck produced a 12-slide deck with a logical flow: problem statement, methodology, data analysis, recommendations, and appendix.
02 / The Workflow: From Outline to Visual Story in 10 Minutes
Here’s the exact process Sarah used — and you can copy it step by step.
Step 1: Import the Outline
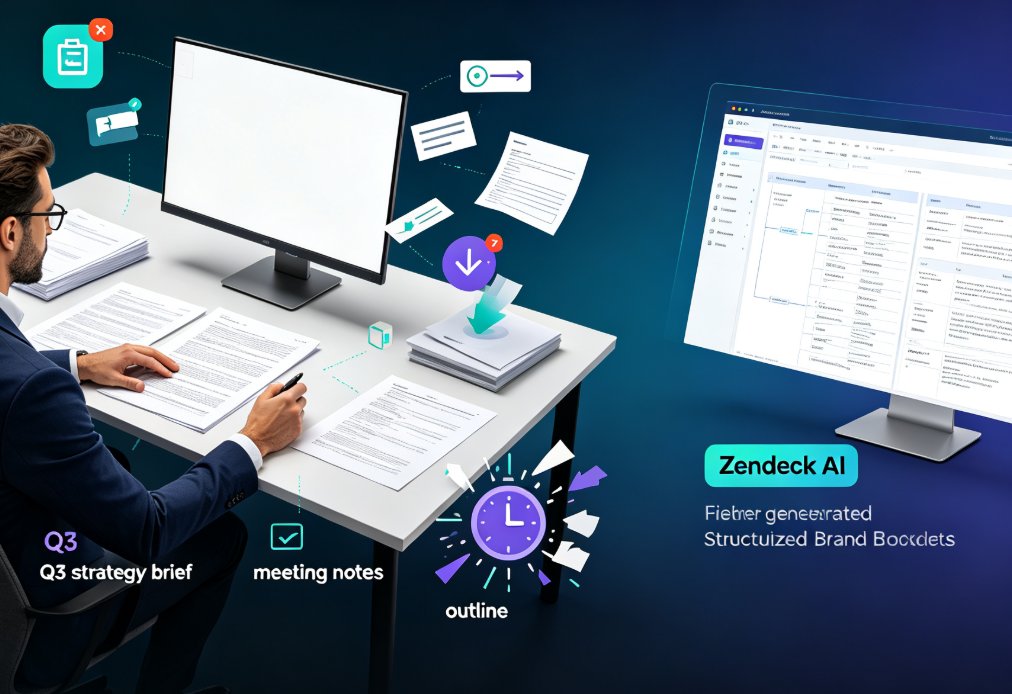
Sarah had her Word outline ready. She converted it to Markdown (Zendeck accepts TXT, Markdown, and direct Word import). She clicked “Import” and let Zendeck parse the headings, subpoints, and data snippets.
Tip: If you’re starting from a PDF report, use Zendeck’s PDF import feature — it extracts text and tables automatically.
Step 2: Choose a Template and Brand Kit
Sarah selected a template from Zendeck’s library — a clean, data-forward design with room for large charts. She then applied a brand kit that matched her firm’s colors and fonts. In two clicks, all 12 slides were on-brand.
Step 3: Let AI Suggest Data Visualizations
This is where the magic happened. Sarah pasted her key data points — revenue growth, customer satisfaction scores, and operational efficiency metrics — into the slide placeholders. Zendeck’s AI analyzed the numbers and suggested the best chart type for each set:
- A bar chart for quarterly revenue trend.
- A line graph for customer satisfaction over time.
- A KPI dashboard for operational metrics.
She didn’t have to build a single chart. The AI generated them instantly, with proper labels, legends, and color-coded categories.
Step 4: Polish with the Asset Library
Sarah wanted to add a few icons and a process diagram. She opened Zendeck’s asset library and searched for “consulting” — icons for strategy, growth, team, and data appeared. She dragged them into slides. The AI automatically adjusted spacing and alignment.
Total time spent: 10 minutes.
03 / The Results: What Changed for Sarah’s Team
To quantify the impact, let’s compare the traditional approach with Zendeck’s AI workflow.
| Task | Manual (PowerPoint) | With Zendeck AI | Time Saved |
|---|---|---|---|
| Creating slide structure from outline | 45 min | 90 sec | 43 min |
| Formatting fonts, colors, and layouts | 30 min | 2 min (auto) | 28 min |
| Building charts from data | 60 min | 5 min (AI suggestions) | 55 min |
| Finding and inserting icons | 20 min | 3 min (asset library) | 17 min |
| Final polish and alignment | 25 min | 2 min | 23 min |
| Total | 3 hours | ~10 minutes | 2h 50min |
The outcome: Sarah finished the deck in 10 minutes, spent the remaining time reviewing the narrative and adding her own insights. The client presentation was a hit — they loved the clarity of the data and the professional look.
But here’s what really matters: Sarah’s team now has a repeatable process. For every new case study, they can clone the template, import new data, and generate a deck in under 15 minutes.
04 / Why This Workflow Works for Any Consultant
You don’t need to be a designer or a data scientist. The key is leveraging AI for the heavy lifting (structure, layout, chart generation) while keeping your human judgment for the story.
Zendeck’s asset library and AI-powered design suggestions are the secret weapons here. They remove the friction of searching for visuals and worrying about alignment. And because the platform is built for collaboration, you can share the deck with a colleague for feedback in real time — no more emailing PPT files back and forth.
If you’re still building case study decks by hand, ask yourself: Is your time better spent on analysis or on formatting?
05 / Key Takeaways to Replicate This
- Start with a structured outline — even if it’s messy. Zendeck’s AI can parse it and suggest a logical flow.
- Use a brand kit upfront to avoid manual formatting later. Check out how to set up brand kits in Zendeck for consistent results.
- Let AI choose the chart type — don’t guess. The tool’s suggestions are based on data patterns, not guesswork.
- Asset library is your best friend — you’ll find icons, illustrations, and diagram templates that make your deck look custom.
- Export to PPTX for client delivery, or share a link for instant feedback. See the export guide for options.
FAQ
How long does it take to generate a case study deck with Zendeck?
From importing a Word outline or pasting Markdown, Zendeck generates a structured deck in under 2 minutes. Adding data charts and customizing assets takes another 5–8 minutes, bringing the total to about 10 minutes for a polished 10–15 slide deck.
Can Zendeck handle sensitive client data?
Yes. Zendeck processes uploaded files in session and does not use your data for model training. For enterprise-level security, check the platform's data handling policies — but for most consultant work, it's safe to import anonymized data.
What types of charts does Zendeck support for data visualization?
Zendeck's asset library includes bar charts, line graphs, pie charts, and KPI dashboards. You can also insert custom icons and illustrations. For advanced data storytelling, you can upload a CSV or paste data and Zendeck will suggest the best chart type.
Do I need design skills to use Zendeck for a case study deck?
No. Zendeck's AI-powered design suggestions automatically unify fonts, colors, and layouts. Even if you import raw text, the generated slides will be on-brand and visually consistent. The platform's template library offers 500+ templates optimized for business presentations.
Can I export the final deck to PowerPoint for client delivery?
Absolutely. Zendeck exports to PPTX, PDF, and Google Slides. You can also share via a link for real-time collaboration. Check the export guide for details.
This article is based on a real workflow used by a consulting team in 2026. Results may vary based on input complexity and template selection.