How to Find and Insert Icons, Charts, and Illustrations with Zendeck
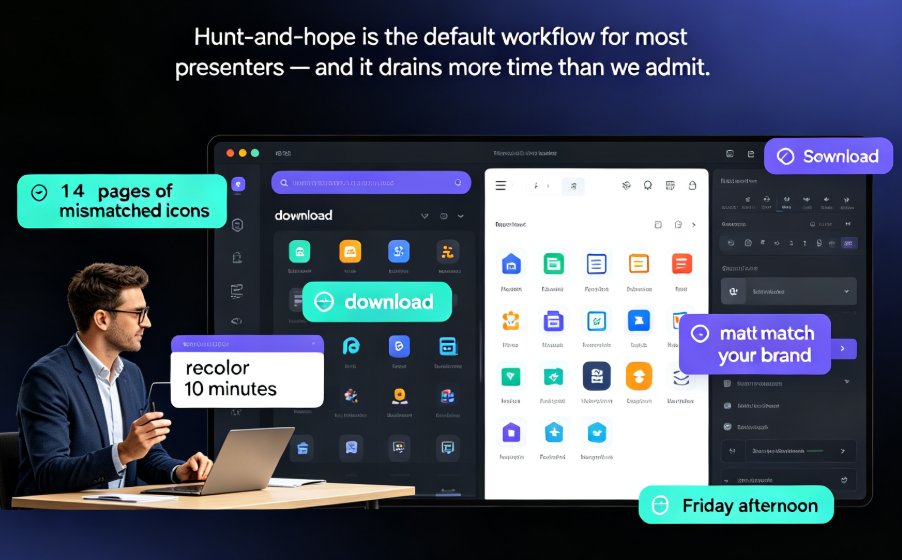
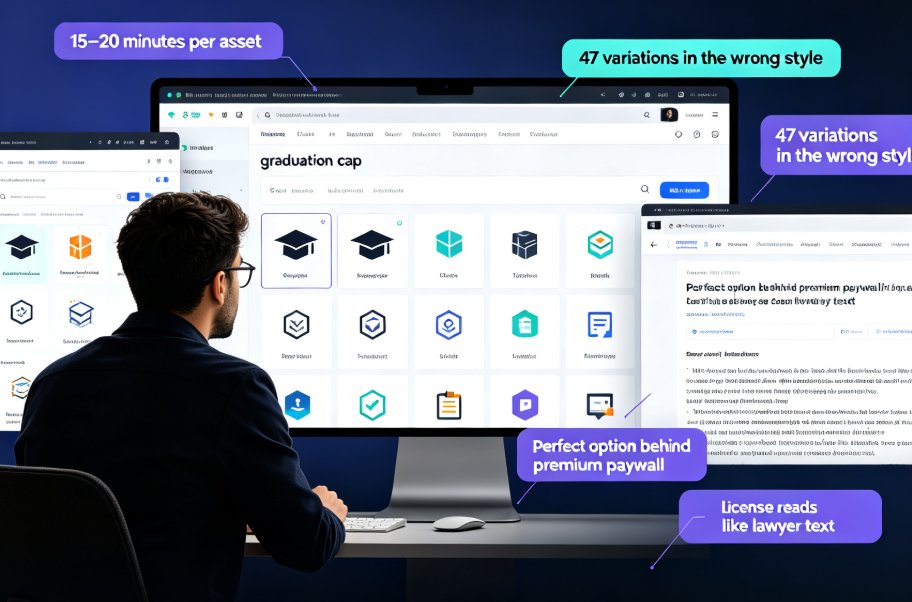
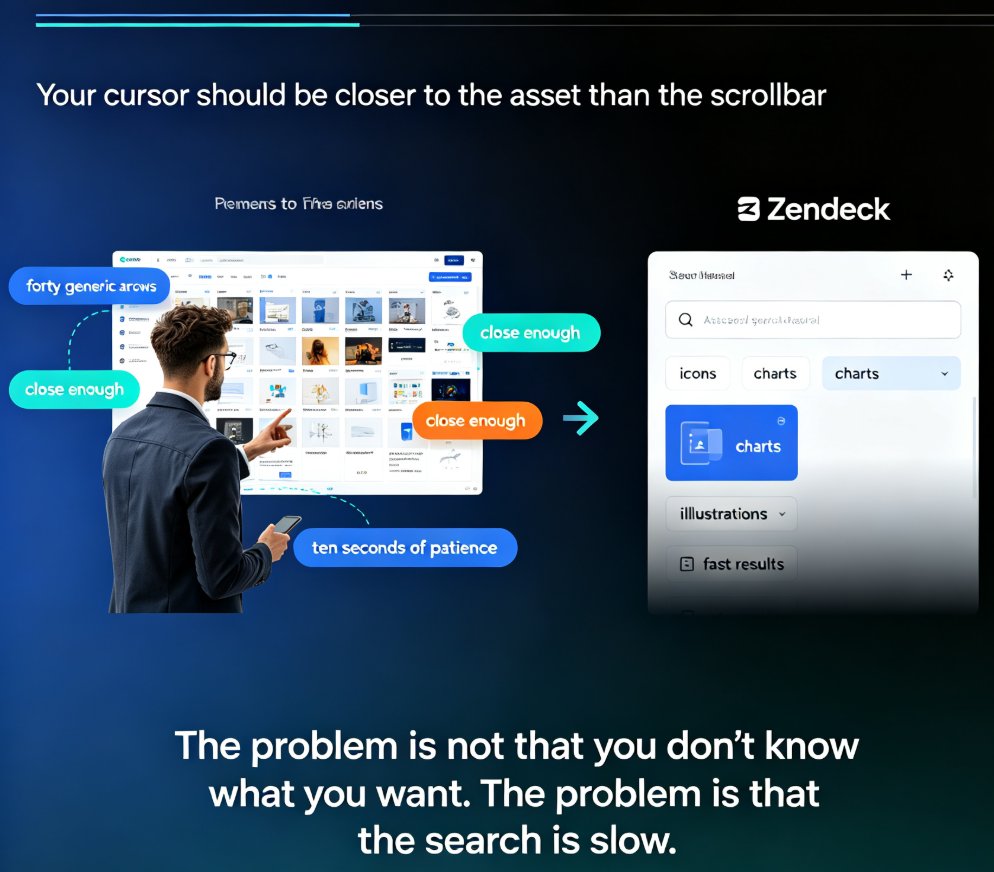
You've got a slide that needs an icon, and you've got about ten seconds of patience left. You open the asset panel, scroll past forty generic arrows, and finally settle on something that's "close enough." We've all been there. The problem isn't that you don't know what you want — it's that the search is slow.
Let's fix that. Zendeck's asset library puts icons, charts, and illustrations within seconds of your cursor, but only if you know how to search it properly. This guide walks through the fastest ways to find the right visual for every slide, without the scrolling.
I. Why the right visual asset matters more than you think
Here's a hard truth about slide design: the visual you choose does more work than the text next to it. A well-placed icon tells your audience "this is a process step" faster than a bullet point ever will. A clean chart says "here's the trend" without a single sentence of explanation.
The flip side is also true. The wrong visual — an icon that doesn't match your point, a chart that's hard to read, an illustration that clashes with your brand — quietly erodes your credibility. Audiences notice when a slide feels off, even if they can't say why.
So the real skill isn't "finding assets." It's finding the right asset fast enough that you don't give up and settle for something mediocre. That's where search technique matters.
II. Search icons like a pro: keywords, filters, and categories
Let's start with icons, since they're the most-used asset in any deck. The default approach — browsing the full library — works when you have no idea what you want. But most of the time, you know exactly what you need: a lightbulb for "idea," a gear for "process," a checkmark for "done."
The fastest way to find the right visual isn't more browsing — it's a better search. In Zendeck, that means three moves:
- Type a plain noun, not a verb or phrase. Search "growth" instead of "showing growth over time." Search "team" instead of "people working together." The library matches on object names, so simpler is better.
- Use the type filter to narrow results. If you only want icons, filter to icons before you search. Mixing icons, charts, and illustrations in one result list slows you down.
- Try synonyms when the first pass comes up empty. "Chart" and "graph" return different sets. "Phone" and "mobile" too. One quick synonym swap often finds exactly what you need.
Here's a quick reference for when each asset type earns its place:
| Asset type | Best for | Search tip | When to skip it |
|---|---|---|---|
| Icons | Process steps, feature callouts, bullet lists | Use plain nouns ("growth", "gear", "check") | Dense data slides where numbers matter more |
| Charts | Trends, comparisons, proportions | Search by chart type ("bar", "line", "pie") | A single number that's better as a big stat |
| Illustrations | Title slides, section dividers, metaphors | Search by theme or mood ("launch", "future") | Text-heavy slides where they'd compete |
That table is worth keeping handy. It's the difference between a ten-second search and a ten-minute scroll.
III. Charts: finding the right data visualization in seconds
Charts are where most people waste the most time, because a chart isn't just a visual — it's a claim. A bar chart says "these categories compare this way." A line chart says "this trend is heading here." Pick the wrong chart type and your data tells the wrong story.
A chart that takes three seconds to insert is a chart you'll actually use. That's the whole point of Zendeck's asset library: the chart is already styled, already sized, and ready for your data. You search by chart type — "bar," "line," "donut," "area" — and the library returns matching options you can drop straight onto the slide.
Once it's on the slide, you replace the sample data with your own numbers. The chart updates in place, keeping the styling Zendeck applied. No rebuilding, no re-formatting, no fighting with axis labels.
If you want to go deeper on making charts interactive or adding them from the asset library, the guide on adding interactive charts to your AI slides covers the full workflow.
IV. Illustrations: when to use them, and how to find the right one
Illustrations are the most underused asset type, and honestly, that's a shame. A good illustration on a title slide sets the tone for the whole deck. A section divider with a relevant illustration tells your audience "new topic coming" without a single word.
The catch: illustrations are harder to search than icons, because they're more about mood than object. You don't search "person with laptop." You search "work," "remote," "focus," or "future."
Think in themes, not objects, when you're hunting for illustrations. Zendeck's library responds well to theme-based keywords. "Launch" gets you rockets and upward motion. "Collaboration" gets you connected shapes and shared spaces. "Growth" gets you plants, stairs, and upward curves.
One rule of thumb: use illustrations sparingly. One strong illustration per section beats five scattered ones. If every slide has a different illustration, the deck feels chaotic. If only the title and section dividers have them, the deck feels intentional.
V. Smart insertion workflows: from search to slide in seconds
Here's where the real time savings happen. Searching well is half the battle; inserting well is the other half. Zendeck's asset library is designed so that the path from "I need a visual" to "it's on my slide" is as short as possible.
The workflow looks like this:
Three steps, no detours. The keyword narrows the field, the filter removes the wrong asset types, and the click places the asset on your slide with styling that already matches your deck.
A few workflow habits that pay off:
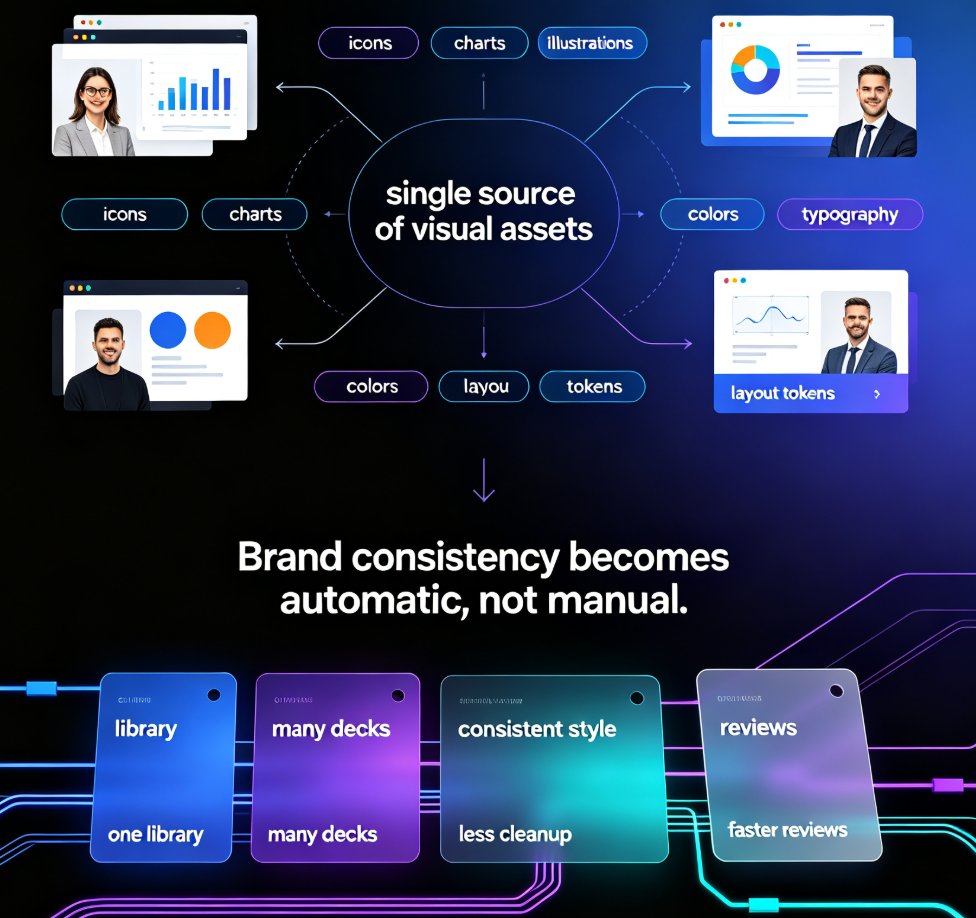
- Search once, reuse often. When you find an icon you like, note the keyword that found it. The same keyword will find matching icons for related slides, keeping your deck visually consistent.
- Let the asset library do the styling. Assets inserted from Zendeck's library come pre-styled to match your theme. Resist the urge to re-color everything — that's where consistency dies.
- Batch your asset hunting. If you're building a ten-slide deck, search for all the assets you need before you start placing them. It's faster than switching between search and layout repeatedly.
If you're building decks for a team, the guide on AI asset libraries and brand consistency explains how to keep everyone on the same visual page.
VI. Common mistakes that slow you down (and how to avoid them)
Let's be real: most people don't struggle with Zendeck's library because it's hard. They struggle because they've built habits from other tools. Here are the three mistakes I see most often, and the fix for each.
Mistake 1: Browsing instead of searching. Scrolling through hundreds of assets is a time sink. Type a keyword. Even a vague one like "arrow" beats scrolling. The search bar is your friend — use it first, every time.
Mistake 2: Mixing asset styles. An outline icon on one slide, a filled icon on the next, a flat illustration on the third — it looks messy, even if each individual asset is fine. Consistency beats variety in slide design. Stick to one style of icon and one illustration style per deck. Zendeck's library groups assets by style, so filter for the style you started with.
Mistake 3: Overloading slides with visuals. A slide with an icon, a chart, and an illustration is a slide with no clear focus. Pick one hero visual per slide. If you need more, that's a sign the slide should be split in two.
VII. The bottom line
Finding and inserting icons, charts, and illustrations doesn't have to be the slow part of deck building. The fastest way to find the right visual isn't more browsing — it's a better search. Type a plain noun, filter by type, click to insert. That's the whole game.
Zendeck's asset library is built for exactly this workflow, so the next time you're staring at a slide that needs an icon, you'll know exactly what to do: search, filter, click, done. For more on how asset libraries are evolving, check out the piece on AI-generated icons and charts, or browse the courseware design category for more deck-building tips.
FAQ
Q: How do I search for icons in Zendeck's asset library? A: Open the asset panel, type a plain noun in the search bar (like "growth" or "gear"), and use the type filter to narrow results to icons. Keep keywords simple — the library matches on object names, so "team" works better than "people working together."
Q: Can I insert charts from the asset library and edit the data? A: Yes. Search by chart type (bar, line, donut, area), click to insert the chart onto your slide, then replace the sample data with your own numbers. The chart updates in place while keeping Zendeck's styling.
Q: What's the best way to search for illustrations? A: Think in themes, not objects. Search "launch," "collaboration," or "future" instead of "person with laptop." Illustrations are mood-based, so theme keywords return much better results than object keywords.
Q: How do I keep my deck visually consistent when using assets? A: Stick to one icon style and one illustration style per deck. Zendeck's library groups assets by style, so filter for the style you started with. Also, resist re-coloring inserted assets — they come pre-styled to match your theme.
Q: Is it faster to browse the library or search it? A: Search, every time. Browsing works only when you have no idea what you want. For anything specific, a keyword search plus a type filter gets you to the right asset in seconds, not minutes.