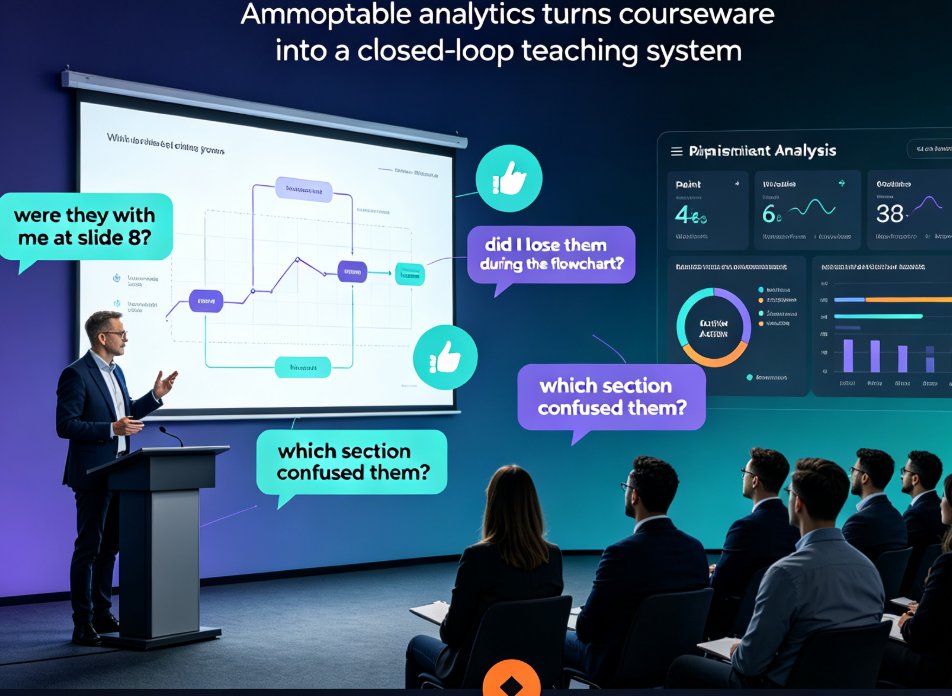
Promptable Analytics for Educators: Courseware Data into Insights
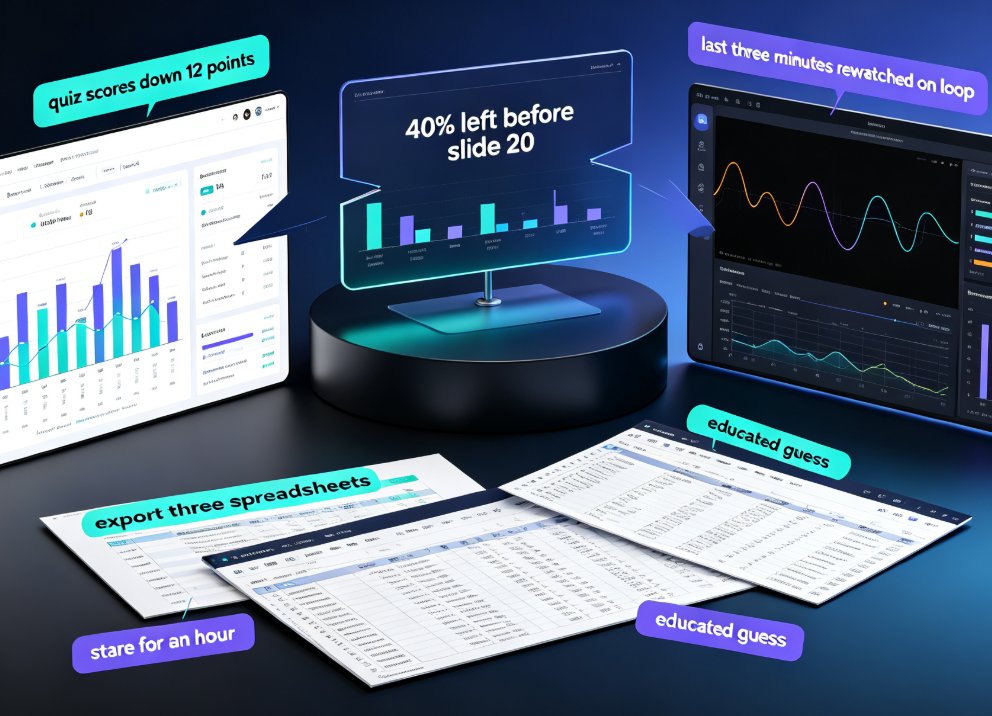
Teachers don't become teachers to wrestle with pivot tables. Yet here we are. You've got an LMS full of quiz scores, a slide platform tracking who clicked through, a video tool logging watch time — and the only way to answer "why did Module 2 fail?" is to export three spreadsheets, stare at them for an hour, and make an educated guess.
Let me introduce you to something that kills that whole workflow: promptable analytics — the ability to ask your courseware data a question in plain English and get a useful answer back in seconds.
That's what this guide covers. By the end, you'll know exactly how educators are turning engagement stats, quiz results, and slide-level behavior into teaching decisions they can act on the same day. And you'll see why this is more than a nice-to-have — the adoption data says it's becoming the norm.
01. Why Educators Are Sitting on Data They Can't Actually Read
Here's the uncomfortable truth: most courseware teams have plenty of data and almost no insight.
The LMS tells you the average quiz score dropped 12 points. The deck platform tells you 40% of learners left before slide 20. The video tool tells you the last three minutes get rewatched on loop. Each metric is telling you something, but none of them are talking to each other.
That's the real problem. Not missing data — fragmented data, trapped behind dashboards you have to configure, filters you have to set, and queries you don't want to write.
For most educators, a meaningful answer means emailing whoever "owns" the analytics and waiting three days. By the time the answer arrives, the cohort has moved on, and you've already adjusted the course based on a hunch.
Sound familiar? You're not alone. This is exactly why the analytics world is quietly moving away from "build me a dashboard" and toward "let me ask a question."
This isn't a niche idea, either. It's part of a broader office efficiency shift — the same natural-language interaction that's rewriting how professionals handle documents, slides, and now, data.
02. What Promptable Analytics Actually Is (and Why It's Not Just Another Dashboard)
Promptable analytics is a way to access and interpret data using natural-language prompts — you ask questions in everyday language and instantly receive AI-driven, context-rich insights.
Think about how you use ChatGPT. You type a messy, half-formed question, and it gives you a structured answer. Promptable analytics brings that same interaction to your courseware metrics — except it's grounded in statistical rigor, not vibes.
In the past, analyzing courseware performance meant relying solely on dashboards and reports, or waiting on data teams for anything beyond a prebuilt chart. Promptable analytics changes who gets to ask questions. It democratizes data access, enabling anyone in an organization — not just analysts — to query operations and uncover answers in seconds.
For a teacher, that's the difference between:
- Before: "I need to export the quiz report, join it with attendance, filter out the audit-mode users, and eyeball which module tanked."
- After: "Which module has the highest in-course drop-off, and what's the average quiz score for learners who did finish?"
One of those takes an afternoon. The other takes ten seconds.
◉ So what can a teacher actually ask?
Realistic questions educators are already putting to their courseware data:
- "Which three slides have the highest exit rate in Module 1?"
- "Is there a correlation between video watch time and quiz score?"
- "What do learners who retake the quiz do differently the second time around?"
- "Which courseware sections generate the most questions in class?"
Each of these is a query a non-technical educator can type. Each returns an answer with context attached, not just a bare number.
03. The Trend Data: Promptable Analytics Is Going Mainstream
You might be thinking, "this sounds nice, but is anyone actually doing it?" The data says yes — and the trajectory is steep.
According to Zendesk's CX Trends 2026 research, the shift toward promptable analytics is well underway in customer-experience teams, and the adoption curve is nearly vertical:
Within two years, 86% of organizations expect to run a prompt-analytics hub — nearly double the 44% that do today.
87% of CX leaders already say AI is significantly improving data and analytics; among high-maturity organizations, that figure jumps to 97%.
Now, these numbers come from customer-experience teams. So why should educators care? Because CX teams measure satisfaction, resolution, and engagement — and you measure comprehension, progression, and completion. The problems are the same shape, and the tools maturing fastest are built for that shape.
Here's the honest part: education-specific promptable analytics is still a step behind CX. But that's good news. It means the playbook is already written, the vendors are already building, and the cost of entry drops every quarter. You get to adopt a pattern that's already been battle-tested elsewhere.
04. How Educators Can Turn Courseware Data into Insights
Let's make this concrete. Here are three scenarios where promptable analytics changes what you can actually do with courseware data.
◉ Scenario 1: "Why did 40% of learners drop off in Module 2?"
Instead of exporting usage logs and building a funnel chart by hand, you ask:
"What's the completion rate by slide in Module 2, and where do learners exit most often?"
The answer comes back ranked: slide 14 shows a 38% exit rate, and it's the slide with the densest text block and zero visual anchor. Now you know exactly where to redesign — not a hunch, a data point.
◉ Scenario 2: "Are quiz scores hiding a pattern?"
You suspect the end-of-module quiz is the real problem, not the content. So you ask:
"Compare quiz scores for learners who completed the video versus those who skipped it, controlling for prior experience."
The AI handles the heavy lifting. Result: skippers score 22% lower — but the gap disappears for experienced learners. That changes your decision. You don't need a harder quiz; you need a mandatory pre-requisite video.
◉ Scenario 3: "What's actually engaging students?"
You prompt: "Which courseware element — video, interactive quiz, or reading — correlates most with course completion?"
The answer shows interactive quizzes correlate 1.6x more with completion than linear video. Next semester, you restructure around a quiz-first format.
The pattern in all three: you bring the teaching judgment, the analytics brings the evidence. That's the entire pitch.
◉ How to start today
You don't need a new platform to begin thinking this way. Start with a self-audit:
- Write down the five questions you most want answered about your last course.
- Check which data source could answer each — LMS, deck analytics, video metrics.
- For the questions no single source answers, that's your shopping list.
The tools are catching up fast. What matters is knowing what to ask.
05. Traditional Analytics vs. Promptable Analytics: Side-by-Side
| Dimension | Traditional Analytics | Promptable Analytics |
|---|---|---|
| Query method | Prebuilt dashboards, SQL, filters | Natural-language questions |
| Who can use it | Analysts, data-literate staff | Anyone, including non-technical educators |
| Time to insight | Hours to days (export, clean, join) | Seconds to minutes |
| Follow-up questions | Requires a new dashboard build | Type the next question instantly |
| Data literacy needed | High | Low — the AI handles the statistics |
| Trend detection | Manual correlation | AI surfaces patterns automatically |
| Error-proneness | Human error in joins and filters | Statistically grounded AI responses |
Notice what's actually changing. Dashboards don't die — they become the backup, not the front door. The front door becomes a conversation.
06. Where Zendeck Fits: Courseware That Answers Back
Here's where Zendeck comes into the picture. Zendeck is an AI-powered content platform that turns outlines and prompts into polished, visually consistent courseware and slides — no design skills required. And the ambition extends beyond making decks. It's about making courseware you can actually measure, improve, and justify.
We're building promptable analytics into the courseware workflow. The idea is simple: you build a course or a slide deck in Zendeck, learners interact with it, and instead of digging through clunky exports, you ask the platform direct questions about how the material performs — engagement, completion, quiz interaction — in plain English.
That aligns with where AI data visualization is heading in 2026: raw numbers becoming something anyone can turn into decision-ready insight. And if you're already building interactive quizzes into your micro-courses, you're collecting more signals for that analytics to mine.
The teaching workflow we're betting on for 2026 looks like this:
- You build a course in Zendeck in minutes.
- Learners interact with it — quizzes, videos, slides.
- You ask the platform, "What's working and what isn't?"
- You iterate on the course the same afternoon.
No analytics team. No SQL. Just a conversation with your courseware data.
That's the shift. It won't replace teaching judgment — nothing should. It just removes the friction between "what happened" and "what you do next."
FAQ
What is promptable analytics for educators?
Promptable analytics lets educators query courseware data using natural-language questions — like "why did 40% of learners drop off in Module 2?" — and receive AI-generated, context-rich insights in seconds, without needing a data team.
Do I need a data team to use promptable analytics?
No. That's the entire point. Promptable analytics is designed to democratize data access, so non-technical teachers and trainers can run queries, spot patterns, and make informed decisions without writing SQL or configuring dashboards.
What data questions can educators ask about courseware?
Practical examples include: which slides have the highest exit rates, whether video watch time correlates with quiz scores, how completers differ from non-completers, and which courseware elements drive the most engagement.
How does Zendeck support promptable analytics for courseware?
Zendeck is integrating promptable analytics into its courseware workflow, so educators who build courses and decks in Zendeck can ask direct, natural-language questions about engagement, completion, and quiz interaction — and make iteration decisions the same day.
Is promptable analytics based on real data or guesses?
Responses are grounded in statistical rigor, not guesswork. As with any analytics tool, insight quality depends on the data your courseware captures — the AI handles the querying and correlation for you.