Zendeck Asset Library: Advanced Tips for Finding Icons & Charts
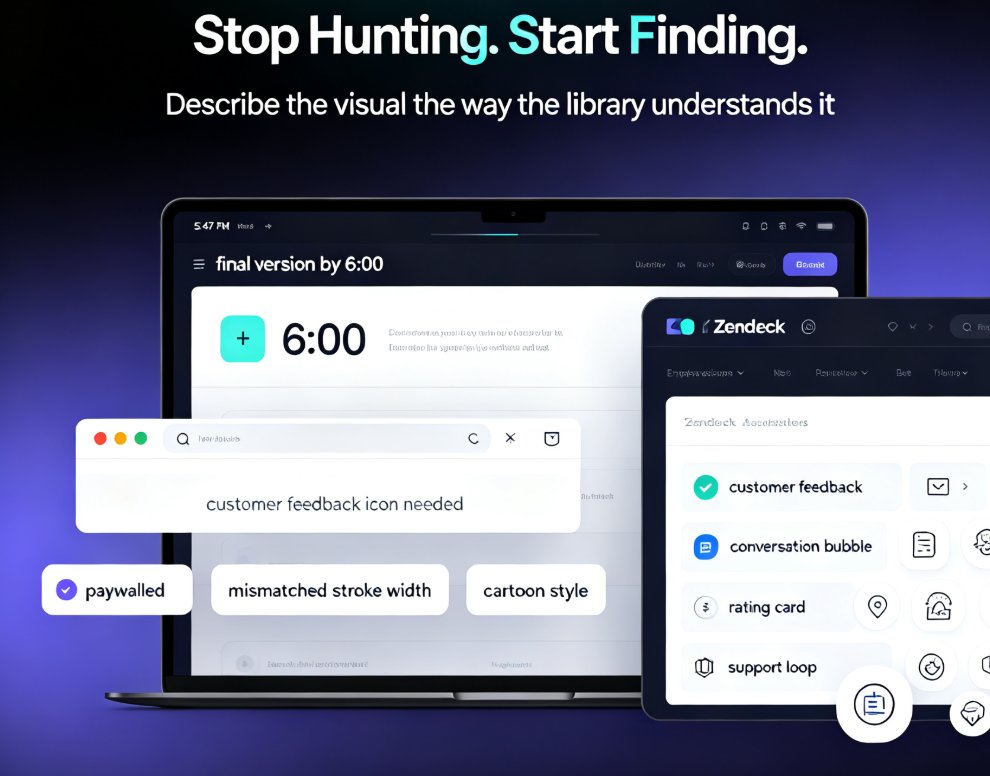
You're finishing a training deck at 5:47 PM and the client wants the final version by 6. One slide still needs an icon for 'customer feedback,' and you've just spent 12 minutes cycling through three icon websites — one is paywalled, one has mismatched stroke widths, and the third only offers cartoon drawings that would look absurd on a corporate slide. You close the tabs, sigh, and think: there has to be a better way.
There is — but only if you stop using the asset library like a photo album and start using it like a search engine. Let's break down how to find the perfect icon, illustration, or chart in seconds, without the scroll fatigue.
01 — Stop Hunting, Start Finding: Why Asset Searches Eat Your Momentum
Every time you break your design flow to hunt for a visual, you pay a switching cost. Your brain ramps down from how does this slide make its point to which website has a decent icon, and ramping back up takes a good two to three minutes. Multiply that by the four or five assets you swap per deck, and you've quietly burned a quarter of your build time on logistics.
The Zendeck asset library fixes the logistics part. Icons, illustrations, charts, and decorative elements all live in one place, styled to work together and sized for your slide geometry. The catch is that most people scroll until something looks "okay" — and that's the slow path.
The fastest way to reach a great visual is to describe it the way the library understands it.
That single mindset shift — from browsing to querying — is what separates a five-minute asset hunt from a twenty-minute one. Here's exactly how to do it.
02 — Search Like a Designer, Not Like a Tourist
Typing 'icon' or 'chart' into an asset search returns a wall of results that all look vaguely different. The fix is to search the way a designer names things:
- Be specific about the concept, not the object. Searching growth beats arrow when you need to show an upward trend.
- Combine concept + shape. Use circle user for an avatar placeholder, shield check for security, chat bubble for feedback.
- Use quotes around exact compound phrases. Searching
"data graph"or"team meeting"returns tighter, more relevant matches than broad terms.
Then layer on the filters you've been ignoring. The Zendeck asset library has filter panes for style, color, and orientation that most users skip. If your deck is built with line icons, filter to line before you start. If every slide carries a blue accent, filter by color family. One tap on the right filter eliminates 80% of irrelevant results on the spot.
The trick is to narrow before you scan, not after. Narrowing first feels slower for the first few seconds, but it saves you from scanning dozens of wrong matches. You're not losing time — you're front-loading the work so the scan itself is almost instant.
A quick note from experience: save your two or three most-used filter presets as defaults. Once you do, every future search starts pre-narrowed, and the whole library starts feeling like it was built around your deck, not the other way around.
03 — Icons, Illustrations, or Charts? Pick the Right Asset for the Job
A common mistake is grabbing any visual that looks nice and forcing the text to fit around it. The library is rich, but each asset type has a specific job. The shortcut is to decide what the slide needs to do first, then pick the asset type.
| Asset type | Works best when… | Falls apart when… | Zendeck search tip |
|---|---|---|---|
| Icons | You need labels, actions, or simple concepts at small sizes | You're explaining a multi-step process | Filter by 'line' or 'filled' to match your deck style |
| Illustrations | You want metaphor, storytelling, or onboarding steps | Precision, small sizes, or dense data | Search concept + scene, e.g., 'team brainstorming' |
| Charts | You're showing numbers, comparisons, or trends | Used decoratively without context | Start from a chart template, not a static image |
If the slide is here's the problem, an icon or illustration sets the mood. If it's here's the evidence, go straight to a chart. If it's here's the roadmap, a timeline or step illustration carries the sequence better than anything else.
And since asset libraries keep evolving, it's worth understanding how AI-generated icons and charts are reshaping what libraries can offer — the short version is that you're no longer limited to a fixed catalog. The system can generate variations that match your deck's specific style, which makes the search even faster.
04 — Build a System: Collections, Favorites, and Brand Consistency
Hunting through the library once is fine. Hunting through it every time you make a deck is wasted effort. The Zendeck asset library includes collections, favorites, and shared team spaces that are genuinely underused.
Here's the system that actually works:
- Create a 'go-to' collection per recurring theme. A training deck might have folders for team building, data review, and action items.
- Star the assets you reuse constantly. Your standard chart layouts, the icon set you always use, and any approved visual treatments.
- Use the brand kit to pre-lock colors. When you insert assets from the library, they inherit the deck's palette instead of fighting it. If you want the next-level version of this, read up on how to create a custom brand kit in Zendeck.
The payoff is that every future deck starts from a system instead of from scratch. And when every deck looks like it shares a family, your audiences start trusting your materials before they read a single word.
05 — Charts That Feel Custom Without Being Custom
Charts are where the asset library shows its real muscle. You can drop in a bar chart, line chart, pie, donut, area, or scatter plot as a starting template, then swap the placeholder data with your own numbers. Because the chart is a native slide element, it instantly inherits the theme's fonts and colors. No more ugly default spreadsheet colors leaking into your presentation.
The efficiency win is real. Let's say you need three charts for a quarterly review. Building them in a spreadsheet tool, exporting as images, and pasting them in — with all the formatting mismatches — eats your afternoon. Inserting a chart template from the library and updating the data takes a minute per chart.
Here's what the time difference actually looks like:
<svg viewBox='0 0 420 260' xmlns='http://www.w3.org/2000/svg' role='img' aria-label='Bar chart comparing minutes spent finding one visual asset'><rect width='420' height='260' fill='#ffffff'/><text x='210' y='24' text-anchor='middle' font-size='13' font-weight='bold' fill='#111827'>Time to Find One Visual (minutes, lower is better)</text><line x1='60' y1='50' x2='60' y2='220' stroke='#9ca3af' stroke-width='1'/><line x1='60' y1='50' x2='380' y2='50' stroke='#e5e7eb' stroke-width='1'/><text x='55' y='54' text-anchor='end' font-size='10' fill='#6b7280'>15</text><line x1='60' y1='106' x2='380' y2='106' stroke='#e5e7eb' stroke-width='1' stroke-dasharray='3,3'/><text x='55' y='110' text-anchor='end' font-size='10' fill='#6b7280'>10</text><line x1='60' y1='163' x2='380' y2='163' stroke='#e5e7eb' stroke-width='1' stroke-dasharray='3,3'/><text x='55' y='167' text-anchor='end' font-size='10' fill='#6b7280'>5</text><line x1='60' y1='220' x2='380' y2='220' stroke='#e5e7eb' stroke-width='1'/><text x='55' y='224' text-anchor='end' font-size='10' fill='#6b7280'>0</text><rect x='80' y='50' width='60' height='170' fill='#e5e7eb' rx='3'/><text x='110' y='42' text-anchor='middle' font-size='11' font-weight='bold' fill='#111827'>15</text><text x='110' y='238' text-anchor='middle' font-size='9' fill='#4b5563'>Manual hunt</text><rect x='180' y='118' width='60' height='102' fill='#93c5fd' rx='3'/><text x='210' y='110' text-anchor='middle' font-size='11' font-weight='bold' fill='#111827'>9</text><text x='210' y='238' text-anchor='middle' font-size='9' fill='#4b5563'>Icon sites</text><rect x='280' y='197' width='60' height='23' fill='#2563eb' rx='3'/><text x='310' y='190' text-anchor='middle' font-size='11' font-weight='bold' fill='#111827'>2</text><text x='310' y='238' text-anchor='middle' font-size='9' fill='#4b5563'>Zendeck</text></svg>
Manual hunting runs around 15 minutes per asset. Generic icon sites get you down to maybe 9 — but then you still have to match style and size. A smart library search with filters lands at 2 minutes. That's a 13-minute saving, per visual, per deck. Over a month of regular courseware or training builds, that's hours back in your week.
If you build data-heavy decks regularly, check out how to add interactive charts to your AI slides with Zendeck's asset library — interactive charts keep your story dynamic without forcing you to manage multiple static versions.
06 — The Shortcut Roundup: Three Habits That Add Up
- Explore the library before you need it. Spend five minutes browsing categories once a week. You'll know what's available before a deadline hits, and you'll stop treating the library like unfamiliar territory.
- When you find a winner, note why it worked. A quick comment in the collection — use for Q3 kickoff — saves you from re-deciding the same thing next month.
- Batch your asset gathering. When starting a deck, pull all the assets for all slides first, then do the layout pass. You stay in 'find mode' for one short burst instead of switching back and forth ten times.
Here's the thing nobody tells you about asset libraries: they're designed to make 90% of your visual needs disappear. With the right filters and collections, the Zendeck library effectively becomes a personal search engine for your exact look — which means your design skills matter less, and your content can finally drive the deck.
And if you're building training modules or courseware, these same habits carry over beautifully: consistent icons, charts, and illustrations across modules make learners trust the material. For more practical guidance in that direction, browse the courseware design collection — it's where your next deck's visual strategy should start.
FAQ
How do I search for icons in Zendeck's asset library?
Type descriptive keywords rather than single object names. Instead of just 'arrow,' search for 'growth arrow' or 'upward trend.' Combine concept and shape, like 'circle user' for avatars, and use quoted phrases such as 'data graph' when you need a specific compound style. Then apply the style, color, and orientation filters on the left panel to narrow the results before you scan.
Can I filter icons and illustrations by visual style?
Yes. Zendeck's asset library includes filters for line icons, filled icons, 3D elements, illustrations, and more. For a consistent look, pick one dominant style per deck and apply that filter first. Filtering by style eliminates most irrelevant matches instantly and keeps every asset on-brand.
What chart types are available in the asset library?
The library includes bar charts, line charts, pie and donut charts, area charts, scatter plots, and several specialized layouts. You can insert them as native templates and swap in your own data, so the chart inherits your deck's fonts and colors automatically instead of looking like a spreadsheet export.
Can I save favorite assets and reuse them across future decks?
Absolutely. Use the collection and star feature to organize recurring assets into themed folders such as 'team building,' 'data review,' or 'action items.' These collections persist across projects, so your next deck starts from an already-curated set instead of a blank search.
Do I need design skills to use the charts effectively?
No. Insert a chart template, paste your numbers, and let Zendeck apply the brand kit colors and typography. If you want interactivity for live presentations, you can also add interactive charts that respond to clicks or hover states — the asset library handles the heavy lifting either way.