Multi-Modal Decks 2026: Images, Charts & Voice Unify the Stack
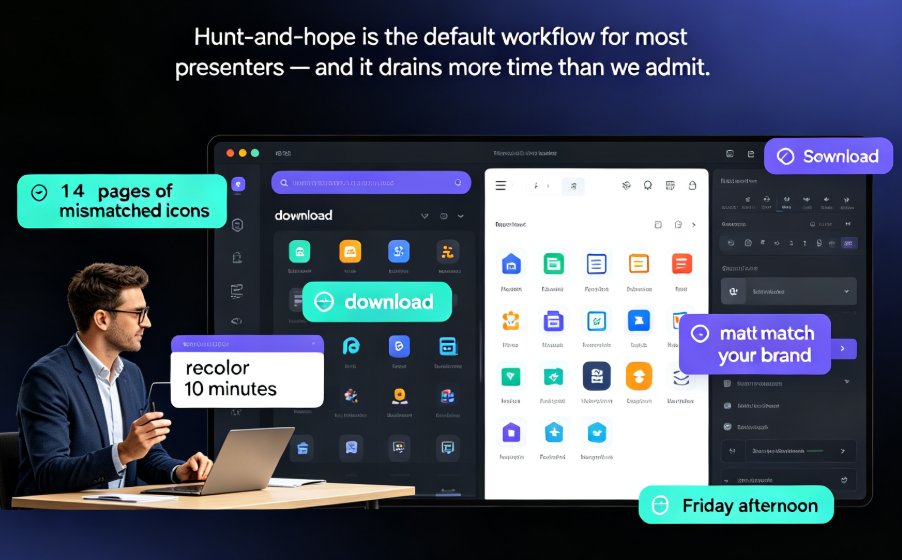
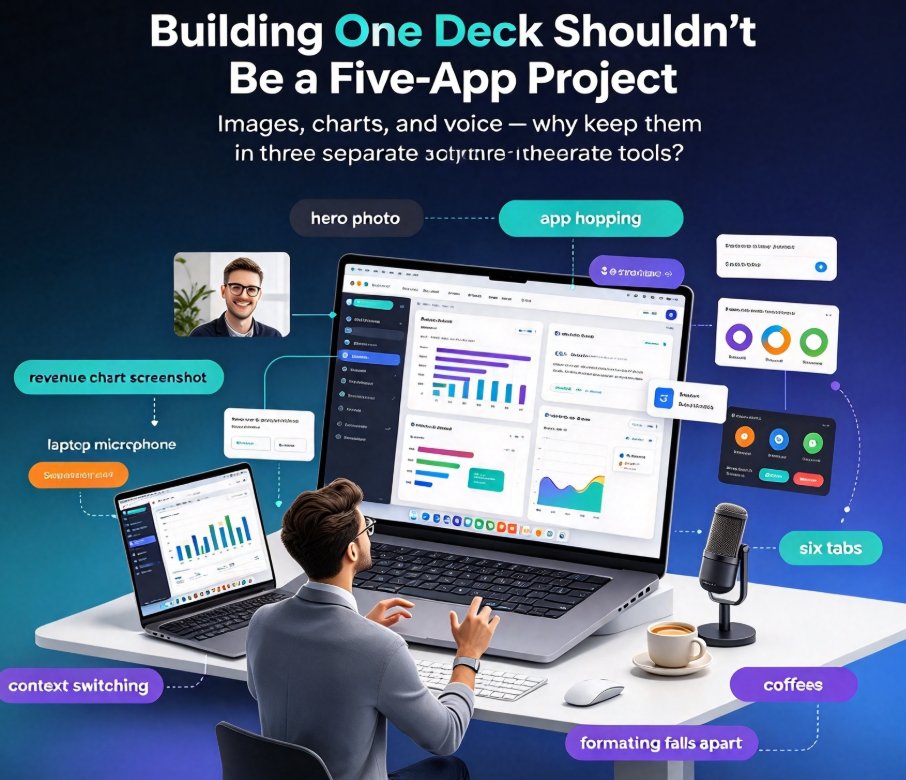
Tuesday, 2:40 PM. You're polishing a 40-slide onboarding deck for next week. You grab a hero photo from one tab, screenshot a revenue chart from another, and then stare at your laptop microphone hoping it'll capture a decent voiceover. Somewhere between the sixth tab and the second coffee, you ask yourself: why is building one deck still a five-app project?
When a 2026 roundup of the best AI presentation tools started highlighting not just design but data and audio, it became clear — the next competitive edge isn't a prettier template. It's the ability to handle images, charts, and voice inside one unified stack, without the tool-hopping that eats your afternoon.
This guide breaks down the three layers of the modern deck, the cost of keeping them separate, and how a single multi-modal canvas changes the math for educators, trainers, and L&D teams.
I. The Tool-Switching Tax Is Real
Here's the math nobody wants to admit: most people don't hate designing slides. They hate the middle step — moving a finished idea from one app into another and watching the formatting fall apart.
In the 2026 comparison from Rework's research team, the tools that ranked highest shared one trait: they reduced context-switching. Canva's Magic Design — familiar, but capped at 10 free AI runs per month — got credit for its massive template library, while Visme was singled out for native charting and infographic depth. The pattern is unmistakable. The winner isn't the app with the most templates; it's the app that lets you do more without leaving.
For educators and L&D professionals, this stings harder than for most. A single courseware session needs slides, a visual metaphor for each concept, at least one chart to make numbers stick, and usually a voiceover so the deck can run asynchronously. The old approach requires three tools minimum. The new approach puts everything on one canvas.
The biggest efficiency win in 2026 isn't a better template — it's a stack that stops forcing you to switch apps in the first place.
Every time you bounce between tools, you pay a hidden tax: exported files lose styling, colors shift, charts get flattened into uneditable images, and audio tracks never quite sync with the slides they're supposed to narrate. It's not a skills problem. It's a workflow problem.
II. Layer One: Visual Assets — Images and Icons That Look Rented vs. Owned
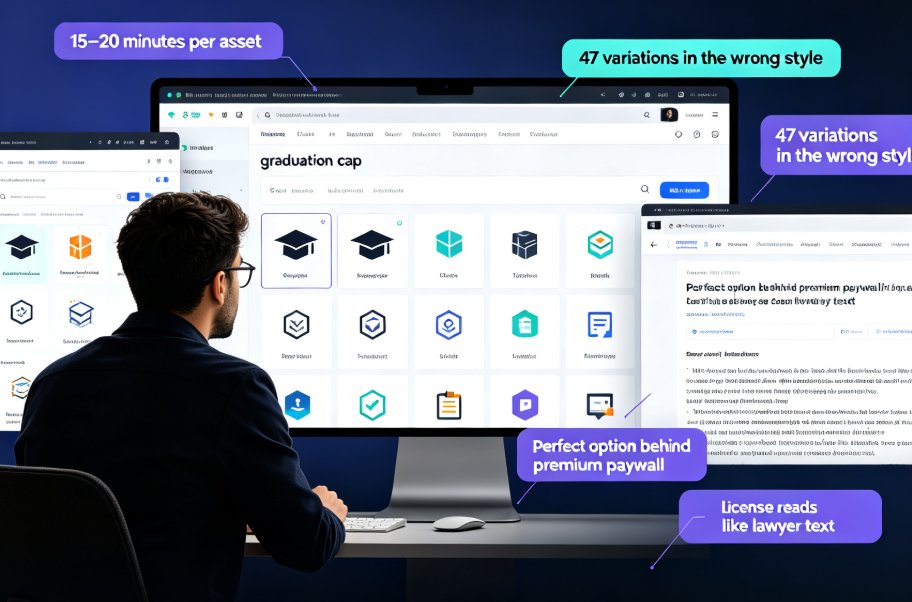
The first layer of any deck is what people see before they read a word. And for years, the standard move was the same: open a stock photo site, hope your team doesn't recognize the exact same hero image from last quarter's competitor pitch, and call it a day.
Multi-modal tools change this by treating visual assets as a managed library, not a hunt. Instead of rummaging through free image sites and pasting screenshots, you pull from an integrated asset system where icons, illustrations, and photos are already styled to match your deck. This is the thinking behind the shift toward AI-powered asset libraries — they don't just give you more images, they give you images that fit.
For internal courseware, brand consistency matters as much as aesthetics. When every slide uses a coherent visual language, learners spend less energy decoding design and more energy absorbing content. Zendeck's asset library is built around this idea: icons, charts, and illustrations that drop into a slide and automatically adopt your color scheme and typography. No more pasting a mismatched icon that breaks the whole visual rhythm.
If brand governance across training materials is a recurring headache for your team, the deeper mechanics are worth exploring — how AI-enforced smart templates keep every deck on-brand with zero manual design review.
III. Layer Two: Data Visualization — Charts That Actually Make Your Case
The second layer is where most decks quietly fail. A slide that says "revenue grew 40%" with a plain bullet point is forgettable. The same slide with a clean ascending bar chart? That's the difference between information and insight.
Traditional workflows treat charts as an export problem. You build the visualization in Excel or Google Sheets, screenshot it, paste it into the deck, and pray nobody asks you to update the numbers — because updating means re-doing the whole dance. It's clunky, it's brittle, and it's why so many decks run on stale data.
The 2026 trend in AI presentation tools is to make data visualization a native slide element, not an imported image. Visme built its reputation on this, and the broader market is following. Editable charts that live inside the deck, recolor themselves to match branding, and refresh when the source numbers change — that's the bar multi-modal tools are now clearing.
Here's what the production math looks like when data lives natively in your deck stack versus living in a separate spreadsheet app. These figures come from our own production benchmarks across dozens of courseware builds:
When your data, visuals, and voice live in the same canvas, a 60-minute deck collapses into a 15-minute one — without dropping quality.
That's not just saving time. It's giving your team the confidence to update numbers instead of dreading them — because refreshing a native chart takes seconds, not a full re-export cycle. If you want practical tips on turning raw spreadsheets into presentation-ready visuals, our data visualization trends guide covers the techniques that age well.
The data layer matters even more in 2026 because audiences have gotten sharper. Learners and stakeholders can smell a stale screenshot from across the room. A live, editable chart that matches your brand sends a signal: this team cares about accuracy. That's a small detail with outsized trust implications.
IV. Layer Three: Voice and Narration — No More Recording Studio
The third layer is the one most deck tools historically ignored: audio. And it's the layer that makes the difference between a deck people present and a deck people assign.
Think about the last time you sat through a silent self-paced training module. It works — technically. But it lacks context, emphasis, and personality. Voiceover turns a passive slide deck into a micro-lesson that can run on its own, which is why PPT-to-video has become the 2026 corporate training standard. Learners can play it in a browser, on a phone, or in a commute playlist.
The old workflow for adding voice was a nightmare: book a quiet room, set up a microphone, record 40 takes because you flubbed one sentence, then spend an hour syncing audio to slides in a video editor. The result was often still mediocre.
AI voice synthesis flips this. You type (or reuse) your script, pick a voice tone, and the tool generates a clean narration track that syncs to your slide timings automatically. Zendeck's narration pipeline even auto-generates subtitles from the audio, covering both speech and accessibility needs in one pass — a detail that matters more as WCAG compliance becomes a procurement requirement in education and government contracts.
The voice layer is the difference between a deck that gets presented and a deck that gets deployed — and deployment is where real training impact happens.
For educators, voice also unlocks synchronous and asynchronous teaching in one asset. Host a live session with yourself narrating, then share the narrated version for anyone who missed it. Same deck, two delivery modes, zero extra production.
V. Why Zendeck Closes the Multi-Modal Loop
So where does Zendeck fit in this stack? It's the tool that treats all three layers as one system instead of three features bolted together.
The asset library gives you the visual layer — icons, charts, and illustrations that match your brand without a hunt through stock sites. Drop an element on a slide and it inherits your deck's color system and typography instantly. No design degree required.
Smart layout gives you the structure. When you import a Word outline or paste Markdown, Zendeck generates a structured, visually consistent deck — and one click reskins everything so fonts, colors, and spacing stay uniform across all 40 slides.
PPT-to-video gives you the voice layer. Add narration, generate a voice track, auto-subtitles kick in, and your static slides become a finished micro-course ready to share. That's the multi-modal promise, delivered as one workflow instead of a five-app juggling act.
If your team is tired of enforcing brand consistency manually, there's a practical framework for setting up your own branded templates that keeps every deck looking intentional.
A quick comparison of what each layer looks like under both approaches:
| Layer | Old workflow (3–5 apps) | Multi-modal single stack (Zendeck) |
|---|---|---|
| Visual assets | Stock sites, manual paste, color mismatch | Integrated library, auto-styled to brand |
| Data charts | Excel → screenshot → paste → brittle | Native editable charts, recolor on import |
| Voice narration | Mic, room, recording, manual sync | AI narration, auto-subtitles, timed to slides |
| Brand consistency | Manual effort, easy to break | One-click reskin, enforced by smart layout |
| Update cost | Re-export everything | Refresh numbers, re-render deck |
VI. A Multi-Modal Workflow You Can Steal by Friday
Here's a practical sequence the next time you build a courseware deck. It's the workflow we use internally, and it keeps production under an hour for a 20-slide module.
Step 1: Start with the outline, not the design. Write your content as a Word outline or Markdown file first. Structure beats aesthetics at this stage — get the story straight before you worry about visuals.
Step 2: Generate the deck, then reskin once. Import the outline into Zendeck, let it generate the slides, and apply your brand kit. One reskin, not a reboot. The 5-hour design stage becomes 15 minutes.
Step 3: Add visuals from the library, not from Google. Drop in a relevant icon or illustration for each key concept. Since assets auto-adopt your palette, consistency is free.
Step 4: Insert charts for anything numerical. Pull the data you'd normally screenshot from Excel and build it as a native chart. It stays editable for future updates.
Step 5: Generate the voiceover last. Write a short script per slide (or reuse bullet points), pick a narrator voice, and let the tool sync audio and subtitles. Export as a video deck for asynchronous learners.
By Friday, you could have a narrated courseware module that would have taken three days under the old workflow. That's the multi-modal dividend.
VII. The 2026 Takeaway
The presentation tool landscape is consolidating. Rework's 2026 roundup made it clear that depth beats breadth — the tools earning top marks are the ones that handle a complete workflow natively, not the ones with the biggest template catalog. Canva's free-tier AI limits, Visme's credit caps on AI Designer, and the general sprawl of tool subscriptions all point in the same direction: people are tired of paying for five tools to do one job.
Multi-modal isn't a buzzword. It's the practical answer to a workflow problem that's been annoying you for years. When images, charts, and voice live in one canvas, the deck stops being a collection of exported fragments and becomes a single coherent asset — one that's faster to build, easier to update, and far more likely to actually get used.
The tools that win your team's workflow in 2026 will be the ones that respect your time as much as your design sensibility. Zendeck was built on that premise, and the asset library plus voice synthesis are where that philosophy shows up in your daily work. If you're still juggling five apps to ship one deck, this is the year to stop.
FAQ
What does multi-modal mean for presentations?
Multi-modal means a single deck canvas handles visual assets (images, icons, illustrations), data (charts, graphs), and voice (narration, subtitles) without forcing you to switch tools. Instead of building slides in one app, screenshotting charts from another, and recording audio in a third, everything lives in one workflow — which keeps formatting consistent and saves hours per deck.
Can Zendeck really replace Canva, Excel, and a voice recorder?
For most courseware and training projects, yes. Zendeck's asset library covers icons, charts, and illustrations, while the PPT-to-video mode adds narration and auto-subtitles. You'd still reach for a dedicated spreadsheet if you need advanced formulas, but for turning a finished outline into a polished narrated deck, Zendeck removes the need for tool-hopping.
Do I need design skills to use multi-modal tools?
No. The whole point of the 2026 multi-modal trend is that design decisions — layout, color, font pairing — are automated. In Zendeck, the smart layout engine and one-click reskin handle visual consistency, so your job is providing content, not making aesthetic calls. When you drop in a chart or an icon, the system adjusts spacing and alignment for you.
How long does it take to add a voiceover to a deck?
With AI narration, a 20-slide deck can get a full voiceover in roughly 3 to 5 minutes, including generating the audio track and syncing subtitles. You can also record your own voice if you want a personal touch. Compare that to the traditional route of booking a quiet room, setting up a mic, and re-recording every flubbed take — the time savings are dramatic.
Is multi-modal only useful for education, or also for business decks?
Both. Courseware is the most obvious fit because it combines slides, visuals, and narration. But sales enablement, investor pitches, and internal training all benefit — any deck where you need numbers to convince, images to illustrate, and a voiceover so the deck can run on its own qualifies.